Representation and Exploration of Data
Select a chapter above and press 'Show Content'. Click a video topic below to view.
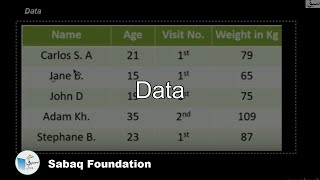
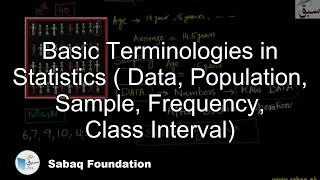
- Data
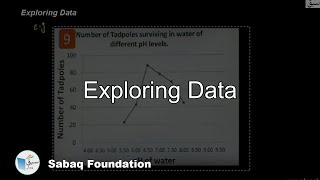
- Exploring Data
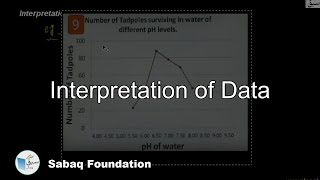
- Interpretation of Data
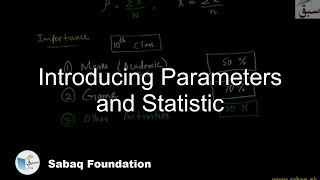
- Introducing Parameters and Statistic
- Accuracy of Measurements & Errors
- Qualitative/Quantitative Data
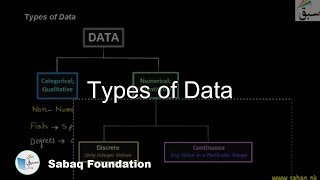
- Types of Data
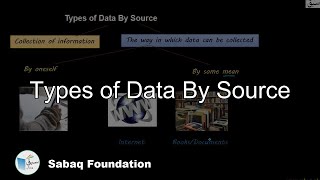
- Types of Data By Source
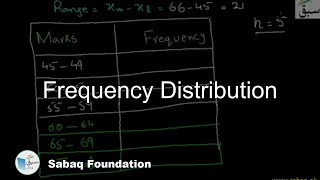
- Frequency Distribution
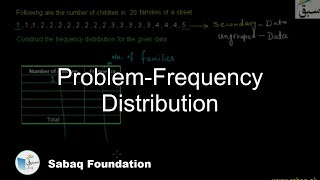
- Problem-Frequency Distribution
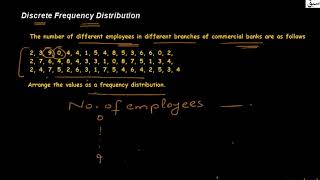
- Discrete Frequency Distribution
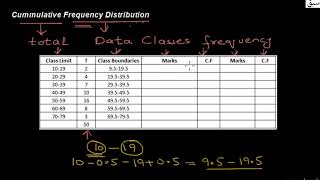
- Cumulative Frequency Distribution
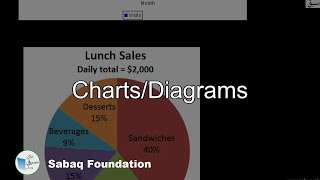
- Charts/Diagrams
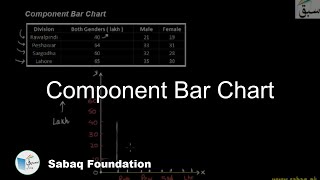
- Component Bar Chart
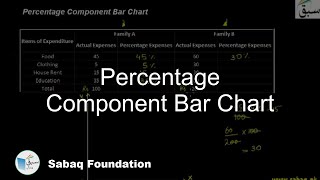
- Percentage Component Bar Chart
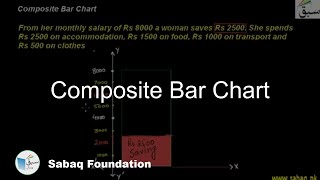
- Composite Bar Chart
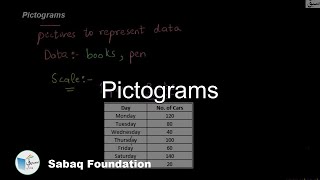
- Pictograms
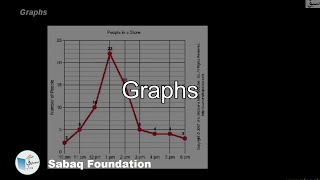
- Graphs
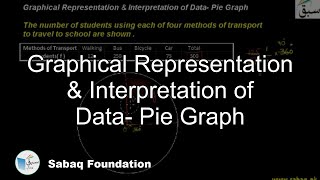
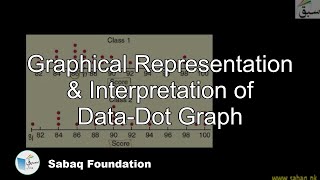
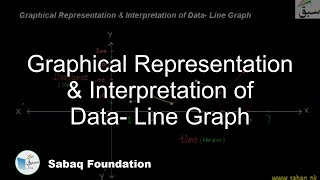
- Interpretation of Data Through Graphs
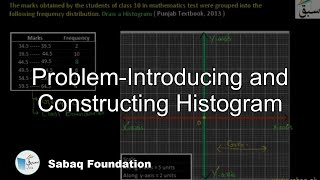
- Creating a Histogram
- Frequency Polygon
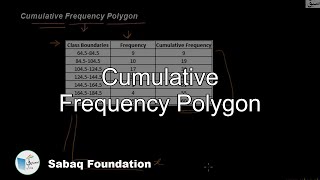
- Cumulative Frequency Polygon
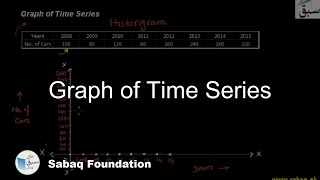
- Graph of Time Series
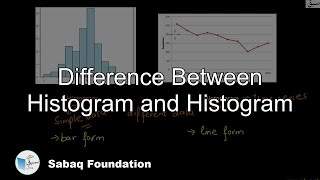
- Difference Between Histogram and Histogram
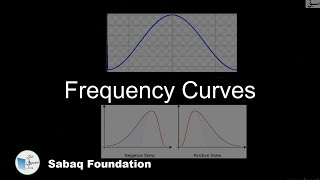
- Frequency Curves
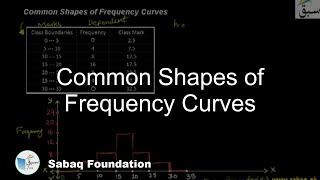
- Common Shapes of Frequency Curves
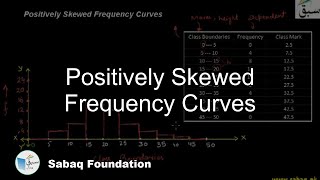
- Positively Skewed Frequency Curves
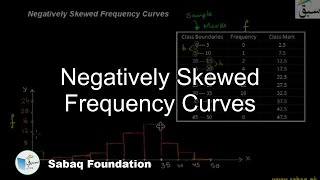
- Negatively Skewed Frequency Curves
Chapter 1 Representation and Exploration of Data (36 videos) (Practice Test)
1.1: Exploring and Interpreting Data (Practice Test)
6716 views
2987 views
2259 views
2256 views
1356 views
880 views
1624 views
387 views
1.2: Frequency Distribution (Practice Test)
13271 views
5188 views
899 views
1354 views
1.3: Charts/Diagrams (Practice Test)
605 views
3021 views
1417 views
797 views
910 views
1.4: Graphs (Practice Test)
353 views
303 views

150 views

174 views
2273 views
384 views
1809 views
1.5: Types of Frequency Curves (Practice Test)
4819 views
439 views
340 views
259 views


